


Workers compensation system explanatory note June 2020
Effectiveness
The monthly dashboard includes measures for the effectiveness of the scheme in keeping workers at work and returning them to work, including the durability or longevity of remaining at work following an absence. These concepts are respectively referred to as ‘stay at work’, ‘return to work’ and ‘sustainability of return to work’. These are key indicators of the workers compensation scheme’s effectiveness, and trends in these measures give a good sense of the scheme’s health.
Research indicates that worker outcomes are improved by recovering at work where possible or early return to work where an absence is required. SIRA’s current strategic priorities include improving return to work (RTW) outcomes for people injured at work and improving measurement and reporting of RTW in NSW. To find out more about the strategic priorities, here is a link.
Stayed at work
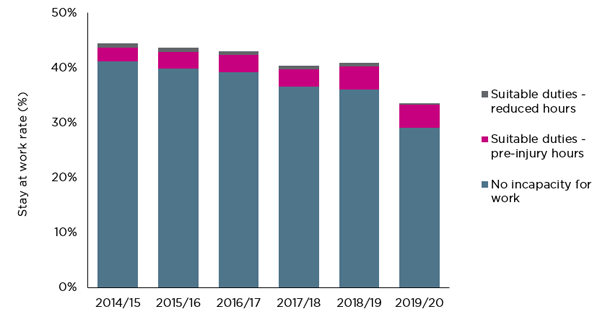
The stayed-at-work rate shows the percentage of workers who made a claim that remained working following their injury. The rates over the years show a decreasing trend and has decreased significantly in the latest period.
Figure 1 – Stayed at work rate
Return to work
The data in this month’s monthly dashboard utilises several methodologies for measuring return to work, each of which shows a continuing downward trend in the scheme.
RTW rates (work status code by the date the claim was entered into the system)
The RTW rate is the proportion of all workers who had time off work following a work-related injury who had returned to work after a particular duration. For example, a 4-week RTW rate of 64.6 percent indicates that 64.6 percent of workers who had time off work because of their injury had returned to work at the four-week mark.
The RTW rate is measured using work status codes at time intervals of 4, 13 and 26 weeks. Recent dashboards have also introduced the same measure at 52 and 104 weeks.
As shown in the following table, the RTW rate decreased at all time intervals between June 2019 and June 2020.
Table 1 - RTW performance – timeseries
RTW rates | June 2020 | June 2019 | Percentage points change between June 2019 and June 2020 |
|---|---|---|---|
4 weeks | 64.60% | 64.76% | -0.16 |
13 weeks | 77.01% | 77.43% | -0.42 |
26 weeks | 82.06% | 82.95% | -0.89 |
52 weeks | 84.46% | 88.95% | -4.49 |
104 weeks | 89.49% | 91.69% | -2.20 |
The following table shows the differences across the insurer types for RTW performance. At 4, 13, 26, and 52 weeks. The Nominal Insurer’s (NI) performance in delivering RTW effectiveness was lower than the other insurer types and lower than the overall scheme performance. All other insurer types had RTW rates higher than the scheme rate and higher than the NI rate at 4, 13, 26 and 52 weeks. At 104 weeks, there is no significant difference in RTW rate between the insurer types.
Table 2 RTW performance – by insurer type
| RTW rate | RTW rate | RTW rate | RTW rate | RTW rate |
|---|---|---|---|---|---|
Scheme | 65% | 77% | 82% | 84% | 89% |
Nominal insurer (NI) | 63% | 75% | 80% | 83% | 89% |
Government self-insurer (TMF) | 69% | 82% | 86% | 89% | 91% |
Specialised Insurers | 72% | 81% | 86% | 88% | 89% |
Self-insurers | 69% | 78% | 83% | 86% | 89% |
RTW rates (work status code by the date of injury)
The RTW rates at 13 weeks by date of injury (DOI) month and by the date the claim was entered into the system (DEIS) month showed a similar trend for both the rolling 12 months average and the single month cohorts returning to work. With both measures, the RTW rate has decreased since 2018 however the performance has remained at around 78% RTW rate in recent months. In the comparison of the RTW methodologies, it appears that the single month cohort RTW rate is more volatile than the rolling 12 months cohort.
Figure 2 – RTW rates at 13 weeks (rolling 12 months average)
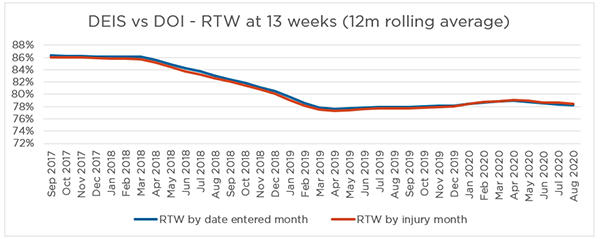
Note - Some claims were excluded from this RTW rate measure due to missing work status code at 13 weeks.
Figure 3 – RTW rates at 13 weeks (single month)
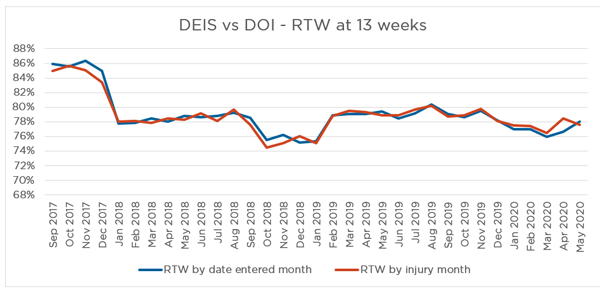
Note - August data was used to report on the RTW rate for the month May 2020, to allow for 3 months development. Some claims were excluded from this RTW rate measure due to missing work status code at 13 weeks.
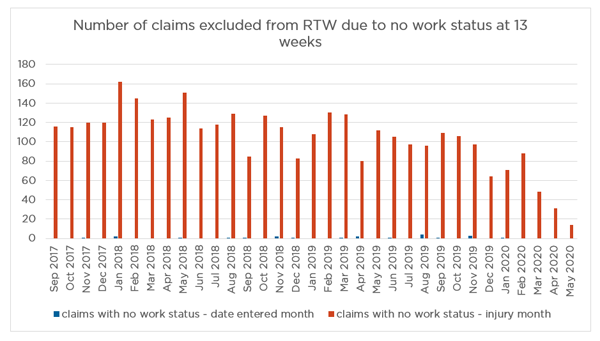
As shown in Figure 4, the number of claims excluded from the RTW rate measure is much higher for RTW by date of injury month than that by date of claimed entered into the system month.
Figure 4 – number of claims excluded from RTW measure
Cost of the scheme’s weekly benefits
The scheme’s total spend weekly benefits continues to increase year-on-year. The total spend for the rolling 12 months to June 2020 was $136M. This compares to $107M for June 2019 and $89M for June 2018.
Number of workers receiving Weekly benefits
Year-on-year the number of workers receiving weekly benefits has increased significantly. In June 2020, there were 35,666 workers receiving weekly benefits, compared with 29,613 in June 2019 and 25,329 in June 2018.
Weekly payments (total payments as percentage of wages) by insurer type
Across all insurer types, there was an initial reduction in weekly payments as a percentage of wages following the 2012 reforms. However, payments as a percentage of wages has steadily increased in the intervening period.
NI
Weekly payments as a percentage of wages have increased significantly for each successive accident year since 2015. Since the 2017 accident year, weekly payments as a percentage of wages have exceeded the 2012 accident year levels, and the 2020 accident year is currently developing at a higher level than the 2019 accident year.
Self-insurer
Weekly payments as a percentage of wages increased in the 2015 accident year and reduced in the 2016 accident year. Since the 2017 accident year, it has been increasing for each successive accident year. The 2020 accident year is developing just under the 2012 accident year levels.
Specialised insurer
Weekly payments as a percentage of wages have increased significantly for the 2018 and 2019 accident years. Weekly payments as a percentage of wages in the 2020 accident year are approaching the 2012 accident year levels.
TMF (emergency)
Weekly payments as a percentage of wages have been increasing significantly for every successive accident year since 2014. Since the 2017 accident year, payments as a percentage of wages have exceeded the 2012 accident year levels, and the 2020 accident year is currently developing at an even higher level compared to the 2019 accident year.
TMF (non-emergency)
Weekly payments as a percentage of wages have increased for every successive accident year since 2015 and the 2020 accident year is developing just under the 2012 accident year levels.
Average number of days of weekly benefits paid in the first 6 months post injury
The average number of days of weekly benefits paid in the first six months after injury has been increasing since the end of 2015. By the end of 2016, the number exceeded the 2012 level. In December 2019, the average number of days of weekly benefits paid in the first 6 months is 28.6.
The increasing average number of days of weekly benefits paid, together with the decreasing stay at work rate, decreasing RTW rates and increasing weekly payments, indicates that the scheme is decreasing in its effectiveness in getting workers back to work.
Viability
The volume of active claims is a key measure of system stability and viability. An increase in active claims and payments per active claim indicates that the scheme is not performing effectively and is not a financially sustainable trend for the scheme.
Scheme costs are increasing
Payments data shows an upward trend in the last 12 months. Overall claim payments have continued to increase. Total claims payments were $3.7B in the 12 months to June 2020, an increase of $429M compared to June 2019. This includes $1.5B of weekly payments, $967M of medical payments, $537M of common law payments and $166M of rehabilitation payments.
In the last 12 months, total weekly payments increased by $287M, of which $213M was contributed by the NI. Total medical payments increased by $51M (6% increase), with private hospital expenses increasing to $144M ($2.7M increase) and surgery expenses increasing to $180M ($3.5M increase). There were increases in payments to allied health services, including physiotherapy ($5.5M increase), psychological services ($7.4M increase) and exercise physiologists ($4M increase).
Across all insurer types, the number of psychological claims as a proportion of total claims reported has increased. Psychological claim payments as a proportion of total claim payments has also increased. Psychological claim payments have higher average costs than other claims, thus the increase in psychological claims proportion significantly increases scheme costs.
NI
Medical payments as a percentage of wages have increased for each successive accident year from 2014 to 2018. Payments from the 2018 accident year have emerged higher than the 2012 accident year levels, and the 2019 and 2020 accident years are following a similar pattern as 2018.
Self-insurers
Medical payments as a percentage of wages have increased since the 2017 accident year.
Specialised insurer
Medical payments as a percentage of wages have increased for each successive accident year since 2017. The percentage in the 2019 accident year is exceeding the level of the 2012 accident year.
TMF (emergency)
Medical payments as a percentage of wages have increased significantly for every successive accident year since 2016. Since the 2017 accident year, the medical payment as a percentage of wages has exceeded the level of the 2012 accident year.
TMF (non-emergency)
Medical payments as a percentage of wages have increased for every successive accident year since 2014. The 2020 accident year is following a similar pattern to the 2019 accident year, which is at its highest level since the 2012 accident year.
Active claims
Active claim numbers are 2% (1,853 claims) higher than in the same reporting period last year (94,141 active claims reported in June 2020 and 92,288 in June 2019).
The NI has the largest market share of the workers compensation scheme in NSW (74%) and the NI active claims rate continues to increase.
The continued increase in the number of active claims across the scheme, combined with other performance results such as the increased duration and number of workers receiving weekly benefits and the increased costs of medical expenses, present significant risks to scheme viability.
Customer experience
From January 2019, all complaints and enquiries from workers about their insurers were serviced by Workers Compensation Independent Review Office (WIRO). Following this change, the number of complaints and enquiries serviced by WIRO has increased significantly from 550 in July 2018 to 1,168 in January 2019.
Enquiries, complaints and disputes increased in June 2020
SIRA and WIRO received 2,477 complaints and enquiries in June 2020, which is an increase from 2,369 enquiries and complaints received in the previous month.
WIRO received 771 enquiries and 644 complaints in June 2020, increased from 627 and 605 in May respectively.
The Workers Compensation Commission received 625 disputes this month, which is fewer than the 649 disputes received in May 2020. The dispute rate for June 2020 is 0.7%, based on the 94,141 active claims in the system.
Feedback on these reports
This monthly dashboard includes several enhancements, feedback and comments on the dashboard reports are welcome. Please email us at: [email protected]
About the data in this report
The dashboard reports data from multiple sources to provide insights into the system performance of the NSW workers compensation system. The report is structured on SIRA’s performance framework, reporting on performance measures of effectiveness, efficiency, viability, affordability, customer experience, and equity.
SIRA as the regulator of the NSW workers compensation system monitors the system regularly. From time to time there are discussions and presentations from providers within the workers compensation ecosystem including insurers, medical and therapeutic providers etc about these metrics.
Methodology, data notes and data sources
The data presented in this report are derived from monthly claims submission data, annual declarations provided to SIRA from NSW workers compensation insurers, the Workers Compensation Commission and the Workers Compensation Independent Review Office and SIRAs complaints and enquiries services.
The financial and cost information in this report is presented in original dollar values with no indexation applied. Costs in the workers compensation scheme are subject to a variety of potential inflationary factors including wage and salary rates, medical fee schedules, statutory benefit indexation and general price inflation. As there is no single index which adjusts for all potential factors, costs have been shown in their original dollar values for simplicity.
The premium value used for the NI in this report is calculated as total premium payable net of GST and levies, such as the dust disease levy and mine safety levy. Premium for self-insurers is deemed premium, calculated as wages covered multiplied by the premium rate applicable for the appropriate industry class. Premium for Government self-insurers (TMF) is the value of the deposit contributions made by each member agency. Premium for specialised insurers is the gross written premium, net of GST and levies, such as the dust disease levy and mine safety levy.
Insurers regularly update claims data based on the progression of a claim. This may result in changing claim details month to month.
Glossary, business terms and data source information
Standard terms | Definitions |
|---|---|
Accident year | An accident year is the year in which the accident giving rise to the claim occurred. |
Active claim | An active claim is a claim that has had any payment activity in the three months as at the end of the same reporting month. |
Affordability | A reflection of the cost of premiums for workers compensation as a percentage of the reported NSW wages bill. The premium value used for the Nominal Insurer is calculated as total premium payable net of GST and levies, such as the dust disease levy and mine safety levy. The premium for self-insurers is deemed premium, calculated as wages covered multiplied by the premium rate applicable for the appropriate industry class. The premium for Government self-insurers (TMF) is the value of the deposit contributions made by each member agency. The premium for specialised insurers is the gross written premium, net of GST and levies, such as the dust disease levy and mine safety levy. Premium information is updated annually. |
Benefits paid directly to workers | Includes weekly payments, common law, s66, death benefits, commutations and miscellaneous payments. |
Benefits paid for services for workers recovery and return to work | Includes medical costs, allied health services e.g. rehabilitation payments to support claimants. |
Bodily location of injury / disease | The bodily location of injury/disease classification is intended to identify the part of the body affected by the most serious injury or disease. Only 1-digit bodily location of injury is used. |
Claim payments types | Claims reported in the reporting month, classified as either 'psychological injuries' for mental disorder claims or 'all non-psychological injuries' for all other claims |
Claim payment development | This chart shows claim payments by accident year. That is, comparing payments of accidents occurring in the 2019/20 financial year with the prior accident period at the same stage of development. This chart allows for like for like comparisons across financial years and is presented in original dollar values with no indexation applied. The financial and cost information in this report is presented in original dollar values with no indexation applied. Costs in the workers compensation scheme are subject to a variety of potential inflationary factors including wage and salary rates, medical fee schedules, statutory benefit indexation and general price inflation. As there is no single index which adjusts for all potential factors, costs have been shown in their original dollar values for simplicity. Note the customer impacted by Section 39 of the act that exited the system up to June 2018 are excluded |
Common Law (WID) payments | Lump sum payments for damages and common law legal expenses incurred by the worker or agent/insurer, pursuant to Part 5 Common Law remedies, Sections 149 to 151AD, Workers Compensation Act 1987 and Section 318H, Workplace Injury Management and Workers Compensation Act 1998. WID stands for ‘Work injury damages’ and this term is used interchangeably with ‘common law’ |
Commutations | The actual gross amount of commutation awarded or agreed upon for the claim. This refers to compensation where a commutation of the claimant's right to compensation has been made by the insurer. The up-front lump sum payment is made to an injured worker in place of continuing weekly compensation award and future medical and hospital expenses, pursuant to Part 3, Division 9 Commutation of compensation, Sections 87D to 87K, Workers Compensation Act 1987. |
Complaint data | Is derived verbatim from reports from customers. Whilst some data cleansing processes are undertaken by SIRA the reporting is verbatim from customers and may from time to time reference an incorrect insurer and/or insurer type. The number of complaints received in the reporting period. |
Complaint types reported to SIRA | Complaints received in the reporting period, split by complaint type. |
Cost to the system for weekly benefits paid per month | This graph shows the costs each month for weekly benefits payments The financial and cost information in this report is presented in original dollar values with no indexation applied. Costs in the workers compensation system are subject to a variety of potential inflationary factors including wage and salary rates, medical fee schedules, statutory benefits indexation and general price inflation. As there is no single index which adjusts for all potential factors, costs have been shown in the original dollar values for simplicity |
Death payments | Funeral expenses, weekly payments for dependent children and lump sum payments paid to the dependants or estate of the deceased worker, pursuant to the Workers Compensation Act 1987 No. 70 and Workers Compensation (Dust Diseases) Act 1942. |
Development quarter | Development quarter refers to the time elapsed (in quarter) the accident occurred. |
Dispute rate | The number of disputes lodged (internal review, merit review, procedural review and workers compensation commission disputes) in the reporting month divided by the number of active claims as at the end of the same reporting month. |
Disputes lodged/finalised | Disputes lodged/finalised in the reporting period. |
Enquiry | An enquiry is defined as a customer call regarding information or advice that is general in nature. The number of enquiries received in the reporting period. |
Injury Financial year | The financial year in which the injury occurred. Starts on 1st July and ends on 30th June the following year |
Insurer expenses | Includes administration and operating expenses, regulatory costs, investigations, insurer’s legal fees etc. |
Internal review | An internal review is a review of the work capacity decision by someone within the insurer other than the person who made the decision. The source of information for the number of internal reviews is the insurers’ submission data to SIRA. |
Investigation payments | Payments for insurer and worker investigation expenses, pursuant to Sections 9A, 11A and 44A, Workers Compensation Act 1987 and Sections 45A, 330, 331, 337, 339 and 376, Workplace Injury Management and Workers Compensation Act 1998. |
Justice | Customers’ perception of how equitably, fairly and justly they were treated is an important measure of the performance of the system. The SWA 2018 RTW survey included asking workers about their perceptions of equity. Workers rated their experience across these four broad dimensions of equity and perceived justice:
Survey respondents rated their agreement with a range of specific attributes on a five-point scale. For the SWA 2018 RTW survey, a range of specific attributes were measured within each of these four dimensions, comprising some 15 attributes. A higher mean score denotes a higher level of agreement (or a higher perceived sense of justice/fairness). |
Level 1 complaints | A level 1 complaint is defined as a complaint received by frontline staff where an insurer is notified (via email) by the Customer Advisory Service on behalf of the complainant. |
Level 2 complaints | A level 2 complaint is an escalation of an unresolved level 1 complaint. |
Lost time | Monthly average, over the last 12 months, of workers who had lost time. |
Lump sum (S66 and S67) | Section 66 payments are lump sum payments for the permanent loss or impairment of a specified bodily function or limb, or severe facial or bodily disfigurement, including interest, pursuant to Section 66, Workers Compensation Act 1987 and as provided by the Table of Disabilities or whole person impairment (WPI) and Ready-reckoner of Benefits Payable. |
Maintain RTW | This measures the duration workers remained at work in a 12-month period after their first return to work. It uses the work status code to calculate how long the worker remained at work. The cohort selection is based on a consistent sample of injured workers who have returned to work for the first time in financial year 2017/18 after the claims are accepted and entered into the scheme with at least one day time loss (excluding retirees and fatalities). The work status code was monitored for subsequent 12 months since the month injured worker returned to work for the first time. Frequency within the following 12 months development period the injured workers remained at work is then categorised into one of the following groups:
The results are based on the work status as at 30 June 2018 |
Mechanism of incident | Mechanism of incident applies to claims entered into the insurer’s system on or after 1 July 2011 and uses the Type of Occurrence Classification System, 3rd Edition (Revision 1) Australian Safety and Compensation Council, Canberra 2008. |
Merit review | A merit review is undertaken by an independent decision maker at SIRA who conducts a merit review of the insurer’s work capacity decision and outlines findings and recommendations. These reviews are binding on the insurers. |
Nature of injury /disease | The nature of injury/disease classification is intended to identify the type of hurt or harm that occurred to the worker. The hurt or harm could be physical or psychological. |
Number of workers receiving weekly benefits per month | Number of injured workers receiving weekly benefit payments excluding Section 39 claimants that exited the system until June 2018. |
Other payments | Payments for repair to or replacement of artificial limbs and clothing because of the workplace injury, amounts paid to any approved interpreter service for English language assistance to the claimant, transport and maintenance expenses related to travel costs incurred by the worker and shared claim payments. |
Payment data | Payments made are based on the transaction date. Payments with payment date within the reporting period. |
Procedural review | A review by the Workers Compensation Independent Review Office (WIRO) can follow a merit review by SIRA and is a procedural review of the insurer’s work capacity decision. |
Psychological Injury (ies) | The range of psychological conditions for which workers compensation may be paid, including post-traumatic stress disorder, anxiety/stress disorder, clinical depression and short-term shock from exposure to disturbing circumstances. |
Records submitted | All records received from insurers across NSW. This data excludes administration errors. |
Rehabilitation payments | Payments for a single workplace rehabilitation service, a suite of services provided to assist a worker to RTW with the same employer, a suite of services provided to assist a worker to RTW with a different employer or travel costs of the workplace rehabilitation provider in the delivery of rehabilitation services, pursuant to Sections 59, 60 and 63A, Workers Compensation Act 1987. Rehabilitation treatment includes the initial rehabilitation assessment, workplace assessment, advice concerning job modification, and rehabilitation counselling. Rehabilitation treatment does not include medical, hospital, physiotherapy or chiropractic treatment. |
Reportable claims | A reportable claim for workers compensation or work injury damages is a claim that a person has made or is entitled to make under the Workplace Injury Management and Workers Compensation Act 1998. Claims become reportable once they meet certain liability conditions and/or have received payments. For example, the injury or illness may be physical or psychological and employment must be a substantial contributing factor to injury, except for those claims made by police officers, paramedics, fire fighters, volunteer bush fire fighters and emergency and rescue services volunteers for injuries suffered during journeys to and from work or place of volunteering. Reportable claims include claims from workers whose employer is uninsured. Where a split by insurer segment is shown, claims of uninsured employers are included with the Nominal Insurer segment. Exclusions Reportable claims exclude administration error claims, claims closed with zero gross incurred cost, claims shared between two or more workers compensation agents/insurers and the agent/insurer is not responsible for the management of the claims, and claims with payments only for recoveries, vocational programs or invalid payment classification numbers. Reportable claims also exclude claims for:
|
Reportable claims / payments development | The reportable claims development chart shows the development of reportable claims by injury/accident financial year. |
Return to work rate | The Return to work (RTW) rate is the percentage of workers who have been off work as a result of their employment-related injury/disease and have returned to work at different points in time from the date the claim was reported (i.e. 4, 13, 26, 52 and 104 weeks for the SIRA Stats report). RTW rates are calculated monthly for the last 13 months up to the date of data. The cohort for each RTW measure is based on claims reported in a 12-month period, with a lag to allow for claim development (i.e., the lag for the 4-week measure is 28 days; the lag for the 13-week measure is 91 days; the lag for the 26-week measure is 182 days; the lag for the 52-week measure is 364 days; and the lag for the 104-week measure is 728 days). Calculation method for 4-week measure for November 2018 is given below as an example:
RTW Rate=b/a multiplied by 100 SIRA identified data quality issues with the accuracy and completeness of data submitted by the Nominal Insurer (NI). The data revealed a significant deterioration in the NI’s RTW performance. To address the data quality and potential performance concerns with the NI, SIRA carried out a Data Quality audit in December 2018 and commenced a Compliance and Performance Review in February 2019 |
RTW including medical only claimants | The percentage of workers at work at 4, 13 and 26 weeks includes medical only claims where the worker did not leave work. The methodology allows a comparison across insurer types of the percentage of workers who were at work at 4, 13 and 26 weeks intervals from the date the claim was entered into the system |
Stayed-at-work rate | The stayed-at-work rate shows the percentage of workers who made a claim and remained working following a work-related injury/disease, that is without losing time at work |
The average number of days weekly benefits are paid to workers for the first six months post injury | Compares the quarters benchmarked across the previous quarters. The chart shows the average number of days of weekly benefits paid to workers in the first 6 months of their claims. This measure uses work hours lost and injury quarter to calculate the average days Note: the data for these measures requires six months to development. |
TMF (emergency) | Government self insurers (TMF) emergency services cover police, fire and ambulance agencies. |
TMF (non-emergency) | Government self-insurers (TMF) non-emergency services cover all agencies under TMF except police, fire and ambulance agencies. |
Weekly benefits paid per month | Weekly benefit payments paid to injured workers for incapacity excluding Section 39 claimants that exited the system until June 2018. |
Weekly payments | Weekly payments paid to an injured worker for incapacity. |
Workers compensation commission | The WCC is an independent statutory tribunal that has jurisdiction to deal with a broad range of disputes. Most of the compensation dispute applications are Applications to Resolve a Dispute (Form 2) and may involve claims for more than one type of compensation benefit, including weekly payments, medical and related treatment, and permanent impairment. |
Data disclaimer
The NSW Government is committed to producing data that is accurate, complete and useful. Notwithstanding its commitment to data quality, the NSW Government gives no warranty as to the fitness of this data for a particular purpose. While every effort is made to ensure data quality, the data is provided “as is”. The burden for fitness of the data rests completely with the user.
The NSW Government shall not be held liable for improper or incorrect use of the data.
Please note, this data is an accurate reflection of the information provided by each insurer, to SIRA, however this data may change due to the progression of data and the application of regular data quality reviews. There are several areas where SIRA is actively working on the methodologies and data sets with the view to improving the measures and the capability to monitor the system.
Would you like additional data?
For more information about this dataset or data source:
There is additional data from the NSW Government on the following sites -
If you need further information please use this link to access information or phone 13 10 50.