


Home building scheme report for the year 2018-2019
Introduction
Welcome to the Home Building Compensation (HBC) scheme performance report. This report aims to provide stakeholders with information about the Home Building Compensation scheme. In addition to the report, this year we are planning to develop a more regular dashboard to provide a high-level snapshot of scheme performance.
In this report, the performance of the scheme is mapped against the scheme objectives of effectiveness, efficiency, viability, affordability, customer experience and equity.
Table 1 HBC scheme performance framework
Objective | Measure |
|---|---|
Effectiveness | Does the scheme deliver protection to homeowners in the event of incomplete or defective work where the contractor has died, disappeared, become insolvent, or has failed to comply with a money order? |
Efficiency | Does the scheme deliver cost effective and timely services? |
Viability | Is the scheme self-funding and financially viable? |
Affordability | Are the premiums (certificates of insurance) affordable and perceived as affordable? |
Customer Experience | Does the scheme offer a positive customer experience? |
Equity | Is the scheme and its eligibility and delivery mechanisms equitable and fair? |
This performance framework will continue to be developed for future reports. We would like your feedback on the framework, the report and other inclusions you might like to see in future reports. Please email us
In addition to the SIRA’s regulatory activity, the Independent Pricing and Regulatory Tribunal (IPART) is currently reviewing the effectiveness and efficiency of the HBC scheme. More information about this review can be found on IPART’s website. Recommendations from the IPART review of the Home Building Compensation scheme will be considered in the next iteration of the performance report.
Executive summary
The following table shows SIRAs assessment of the 2018/19 scheme performance
Table 2 Assessment of HBC scheme performance
Objective | Rating1 | Assessment | |
|---|---|---|---|
Effectiveness | Does the scheme deliver protection to homeowners in the event of incomplete or defective work where the contractor is unable to honour their contractual commitments due to insolvency, death, disappearance or licence cancellation | As a last resort scheme the Home Building Compensation scheme delivers a safety net insurance for homeowners building projects primarily 3 storeys and under and some renovations to residential buildings with 68,614 certificates of insurance issued over 2018/19. There was a 12 percent decrease in the number of certificates issued relative to 2017/18 levels, commensurate with the reduction in construction activity. | |
Efficiency | Does the scheme deliver cost effective and timely services? |
| As icare HBCF is the sole provider of HBC cover, benchmarking performance between providers is not possible. However, anecdotal evidence suggests that the current cost of claims and expenses is high relative to previous years and other jurisdictions. The IPART review may also comment on scheme efficiency. |
Viability
| Is the scheme financially viable for generations to come? | To date there has been a shortfall between premiums and the expected cost of claims and expenses. Premiums are moving towards fully funded levels; however, the scheme continues to rely on support from Treasury. At 30 June 2019, there were 40 cents in assets for every dollar in liabilities. | |
Affordability
| Are the premiums (certificates of insurance) affordable and perceived as affordable? |
| For low risk construction types, premiums are affordable when measured as a percentage of contract value. However, breakeven premiums for higher risk construction types exceed 5 percent, which represents a relatively significant impact on the overall cost of construction. |
Customer Experience | Does the scheme offer a positive customer experience?
| This segment of the performance framework is being further developed by SIRA for future reporting and at this stage it is not possible to rate the scheme performance against this framework segment. However, anecdotal evidence suggests that some builders find the eligibility requirements imposed by icare onerous and some homeowners believe claims take too long to be resolved. | |
Equity | Is the scheme and its eligibility and delivery mechanisms equitable and fair?
| In an equitable scheme, there should be large number of contractors with eligibility able to perform contracted works. The HBC scheme has approximately 19,500 eligible contractors able to perform contracted works |
Scheme performance assessment criteria
The ratings used to assess the performance of the scheme are set out in the table below.
Category | |
|---|---|
Scheme performance represents a high risk to the scheme | |
Scheme performance represents some risk the scheme | |
Scheme performance represents limited risk to the scheme |
1. The rating assessment legend is displayed in Appendix C.
About the State Insurance Regulatory Authority
The State Insurance Regulatory Authority (SIRA) was established in 2015 to regulate workers compensation insurance, motor accidents compulsory third party (CTP) insurance and Home Building Compensation (HBC) scheme in NSW. SIRA advances the wellbeing and confidence of the people and businesses of NSW through sustainable insurance and support systems so customers can actively engage in the economy and society.
Our purpose
As the regulator, our purpose is to ensure that insurance and support systems are easy to deal with and deliver protection, entitlements, and good outcomes at an affordable price and in a sustainable way.
Our mission
We undertake effective system-wide regulation by monitoring and managing system effectiveness, efficiency, viability, affordability, experience and equity.
As system-steward, we want to make sure our systems:
- are effective in delivering scheme outcomes
- are delivered as efficiently as they can be
- are affordable for the community
- are sustainable and viable for generations to come
- provide positive experiences
- are equitable and perceived as fair.
Regulation of the Home Building Compensation system
SIRA supervises and monitors the performance of insurers through:
- regular engagement and feedback
- data analysis
- capability development
- compliance and performance monitoring
- education and support.
SIRA takes a risk-based and proactive regulatory approach in its supervision and regulation of the current insurer. SIRA’s focus is on prudential management, conduct and claims management performance.
SIRA’s regulatory activities commence with evidence-based inputs identified through internally initiated supervisory activities or from notification of issues by external sources. Collectively, this is known as SIRA’s insurer supervision model. Information obtained is assessed to identify risks, legislative breaches and stakeholder and system impacts.
About the Home Building Compensation Scheme
The Home Building Compensation (HBC) Scheme is governed by the Home Building Act 1989. The Scheme provides a last-resort safety net for homeowners if a contractor is unable to complete work on their home or remedy a breach of statutory warranty. Contractors are businesses (corporations, partnerships or individuals) that hold a ‘contractor licence’ under the Act to conduct residential building work (which may include building, trades or specialist work on a dwelling or related structure such as a swimming pool).
Contractors must buy insurance under the scheme for each residential building work project over $20,000, unless exempt. Work that is exempt from the Scheme includes work involved in the construction of new multi-storey buildings (buildings with more than three storeys and containing two or more separate home units).
HBC insurance cover must be at least $340,000. The insurance extends to subsequent purchasers of the property (if the insurance has not been exhausted by a prior claim). The Scheme was formerly known as the Home Warranty Insurance Scheme.
From 1 September 2015, the State Insurance Regulatory Authority (SIRA) assumed the regulatory functions of the HBC Scheme, which were previously undertaken by NSW Fair Trading. The NSW Self Insurance Corporation (trading as icare HBCF) has written all HBC insurance in NSW since 1 July 2010.
HBC insurance provided in NSW prior to 1 July 2010 was written by insurers approved by the Minister. These insurers are referred to as ‘runoff insurers’ and all ceased writing business on or before 30 June 2010. Runoff insurers continue to manage and settle claims on policies written up until the date they ceased writing HBC business.
In June 2017, the NSW Parliament passed the Home Building Amendment (Compensation Reform) Act 2017. The Amendment Act commenced on 1 January 2018 and allows private insurers or alternate indemnity product providers to apply to SIRA for a license to enter home building compensation market. At the time of the writing of this report, the NSW Self Insurance Corporation trading as ‘icare HBCF’ was the single HBC licence holder.
About this report
The information presented in this report is primarily derived from insurer data received from icare, the scheme insurer. In addition, this report utilises data provided from icare HBCF’s annual declarations e.g. Premium filings and regular data exchanges with SIRA. SIRA has endeavoured to utilise the best possible data in this report balancing timeliness of the reporting with the longtail claims development cycle and data maturation.
Care should be taken in interpreting claims data for the more recent years, as it can take many years for claims related to building defects to emerge, and for the full claim costs to be known. In addition, some data quality challenges relating to completeness and correctness have been identified, which can impact the analysis in the report. It is important that SIRA transparently notes this for users of this report.
The data in this report for 2018/19 is as at 30 June 2019, except where otherwise indicated. The financial and cost information in this report is presented in original dollar values – without indexation. This report primarily focusses on insurance issued since 1 July 2010 for whichicare HBCF has been the sole provider.
Further information on the HBC scheme and reforms is available on the sira website.
A glossary of terms, data notes and acronyms is provided at the end of this report.
Home Building Compensation and COVID-19
Australia’s general insurance sector incurred a particularly severe level of claims arising from a series of natural catastrophes prior to the onset of COVID-19. Whilst the events so far have impacted earnings rather than capital, there remains significant future risk of decreased business volumes, increased claims activity and more expensive reinsurance. These issues have been exacerbated by the COVID-19 pandemic. The ultimate impact of COVID-19 on the HBC scheme and other insurance business is likely to remain uncertain for some time.
Impacts of COVID-19 relevant to the HBC scheme including the following:
- A reduction in construction activity – COVID-19 is expected to accelerate a reduction in construction activity, which commenced in 2019. The Commonwealth Government’s HomeBuilder program is expected to offset some of the reduction in construction activity; however, the impact of the program is likely to vary between regions and states. Premium income will reduce in line with the reduction in construction activity, however this will correlate with a reduction in risk exposure for the scheme.
- An increase in the number of contractor insolvencies leading to an increase in claims – A decrease in construction activity is likely to put financial pressure on contractors and may lead to an increase in builder insolvencies, which is a key trigger for HBC claims. The temporary changes to insolvency laws and the HomeBuilder program may mitigate the risk of insolvencies; however, an increase is likely nonetheless, which is likely to result in an increase in claims volumes.
- A reduction in insurer investment income – Insurers fund claims liabilities from a combination of premium revenues and investment returns. A depressed economic climate is likely to result in sustained low investment returns, which is expected to place further pressure on the scheme’s financial position.
Scheme performance – Effectiveness
Does the scheme deliver a last resort or safety net insurance for homeowners?
Effectiveness has been assessed in this report across the types of projects covered by the scheme. Ideally, the scheme should provide a safety net to homeowners and allow contractors to perform the contracted works.
As the scheme is compulsory, there should be broad alignment between the number of certificates issued and the number of new dwelling unit approvals.
Number of certificates issued
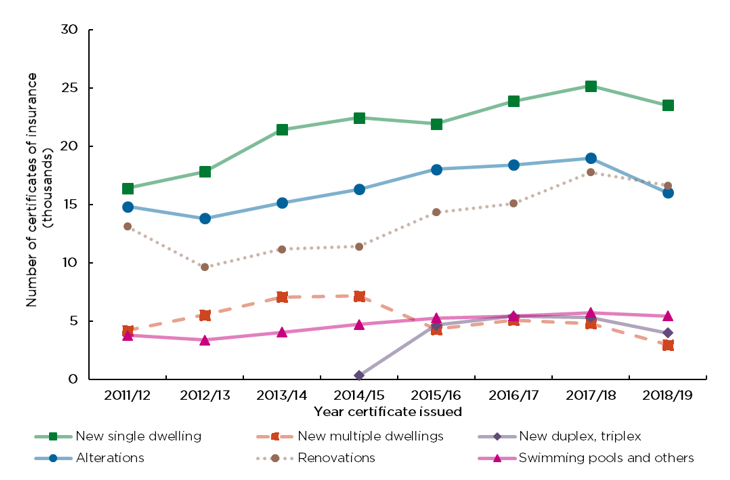
Figure 1 displays the number of certificates of HBC insurance issued by construction type. 68,614 certificates of insurance were issued in 2018/19. There was a 12 percent decrease in the number of certificates issued relative to the 2017/18 levels, this is reflective of the reduction in construction activity observed in the period.
New single dwellings accounted for approximately one-third of all certificates issued in 2018/19.
Figure 1 Number of certificates by construction type and issue year
Comparing the number of certificates issued with the number of new dwelling unit approvals
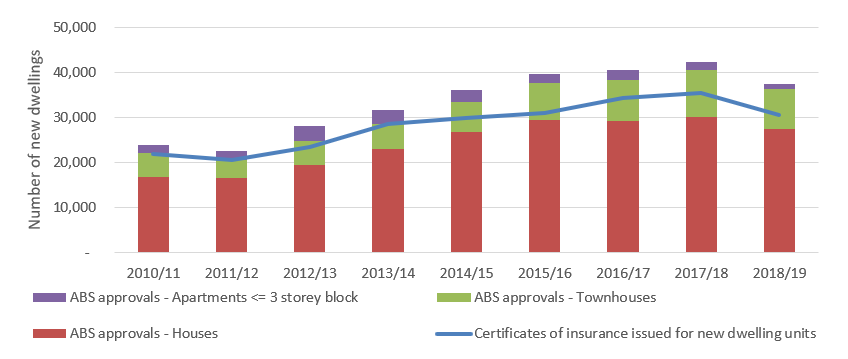
Figure 2 compares the number of new residential building approvals with the number of certificates of insurance issued for new dwellings. New residential building approvals are sourced from the Australian Bureau of Statistics (ABS). Some differences between the series are expected as not all approved projects will commence, and some approved projects may relate to exempt work that does not require insurance.
The number of new residential building approvals is broadly in line with the number of certificates of insurance issued for new single, multiple and duplex / triplex dwellings.
Figure 2 New residential building approvals by construction type
Scheme performance – Efficiency
Does the scheme deliver cost effective and timely services?
In this report, we assess efficiency by considering the characteristics and volume of notifications, claims and claim payments in the scheme and its associated services.
There are several regulatory and operational processes that impact the efficiency of HBC scheme. These include contractor licencing, eligibility assessments, dispute resolution processes and the regulation of building standards. Changes made in any one of these areas may have an impact on HBC scheme performance and its service to customers.
As icare HBCF is the sole provider of HBC cover, benchmarking performance between providers is not possible. However, anecdotal evidence suggests that the current cost of claims and expenses is high relative to previous years and other jurisdictions. The IPART review may offer some insights on scheme efficiency.
Notifications and reported claims
Delays between the purchase of insurance, commencement of work, finalisation of work, and the detection and reporting of defects means that it takes many years for claims to emerge. As a result, notifications received in a particular year often relate to policies issued many years earlier.
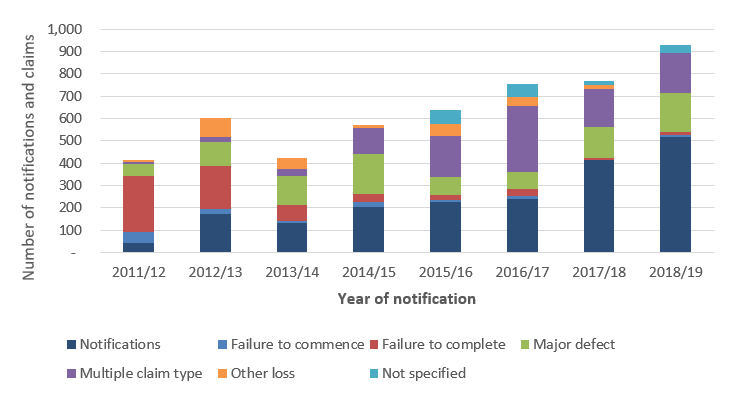
Figure 3 displays the number of notifications and claims reported by claim type and year of notification as at 30 June 2019. A ‘notification of loss’ by a homeowner becomes a claim if one of the conditions for entry into the scheme is satisfied, for example where the contractor has died, cannot be located, is insolvent, or has their licence suspended for not complying with a money order issued by the NCAT or court.
Compared to the previous year, the number of notifications and claims reported increased from 769 in 2017/18 to 928 in 2018/19. There were 174 major defect claims reported. As well, the number of claims with multiple claim types has increased in recent notification years.
The downturn in construction activity associated with COVID-19 is expected to lead to an increase in the number of claims reported in 2019/20 in both the non-completion and defect claims categories. The increase in non-completion claims may be observable sooner than for defect claims due to the time it takes to identify and report defective work.
Figure 3 Number of notifications and reported claims
Cumulative number of claims reported by issue year
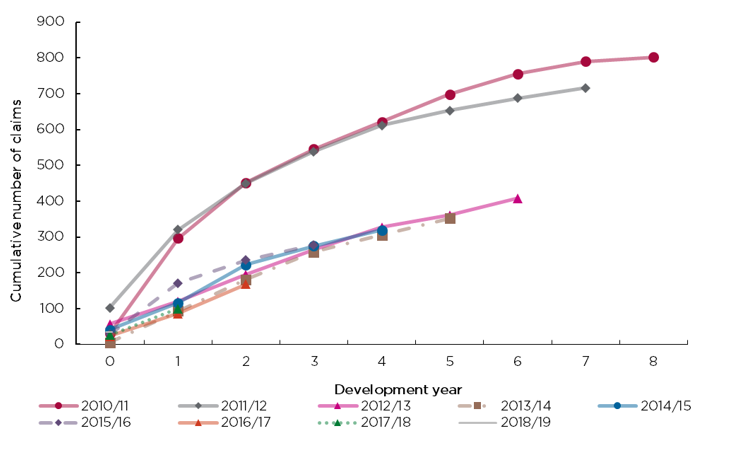
Figure 4 displays the cumulative number of claims reported by certificate issue year. Development year 0 means the claim was notified in the same year the policy was issued. Development year 1 means the claim was notified in the financial year after the policy was issued etc.
The higher than average number of claims reported in the first two development years for certificates issued in 2010/11 and 2011/12 aligns with a period of below average construction activity. This illustrates that periods of depressed construction activity generally correlate with higher claims volumes across all exposed certificate issue years. This arises because contractors face increased financial hardship during periods of low construction activity and more contractors become insolvent, enabling claims to be made against the insurance in cases of non-completion or defect.
The claims impact from the downturn in construction activity that commenced in mid-2019 and which has been exacerbated by the COVID-19 pandemic is not yet apparent in the claims development profile but is likely to appear in future reporting.
Figure 4 Cumulative number of claims reported by issue year
Claim payments
Figure 5 displays gross claim payments (excluding recoveries) by claim type and payment year for certificates issued from 1 July 2010. Note that gross payments displayed in this section are inclusive of GST.
$49M in payments were made in 2018/19, of which $35 million (72 percent) relates to major defects and $9 million (18 percent) relates to incompletion. The amount and proportion of payments related to major defect claims has increased year-on-year since 2010/11.
Figure 5 Claim payments by payment year and claim type ($ millions)
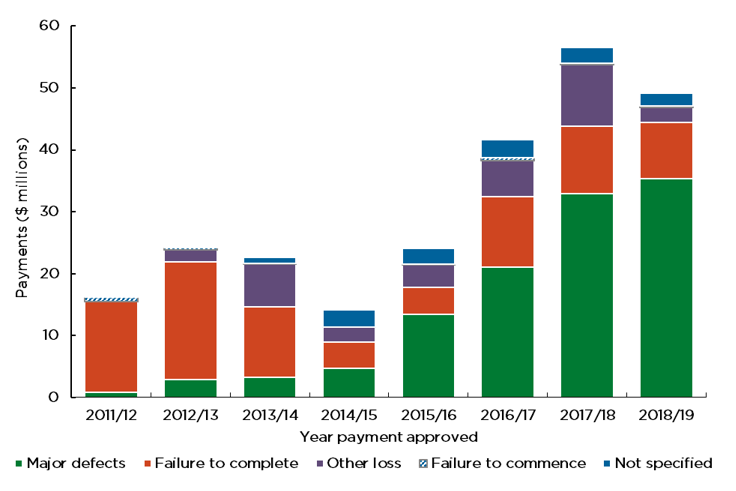
Note - Gross payments displayed in this section are inclusive of GST.
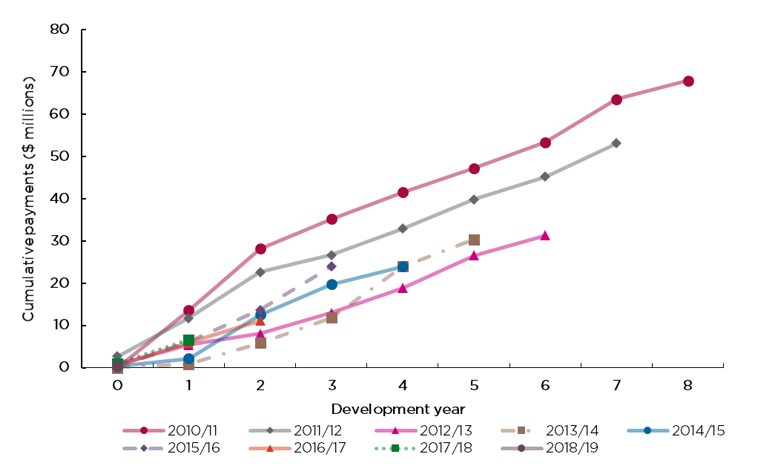
Cumulative payments by year of certificate issue
Figure 6 displays cumulative payments by certificate issue year. The development year has the same definition as for reported claims.
Cumulative claim payments relating to more recent certificate issued years are developing more favourably than for the 2010/11 and 2011/12 issue years. This favourable experience has occurred in an environment where there has been significant growth in the construction activity. At this point in time, there is no evidence of a flattening of the curve for claims payments for older issue years.
Figure 6 Cumulative claim payments by issue year ($ millions)
Scheme performance – Viability
Is the scheme self-funding and financially viable?
The stability of claim costs, premium pricing and the adequacy of reserves held against future claims liabilities are important measures of scheme viability and long-term sustainability.
To assess the alignment between the adequacy of the reserves held and the 2018/19 scheme performance, the report compares premiums to claim payments and analyses the scheme’s financial position.
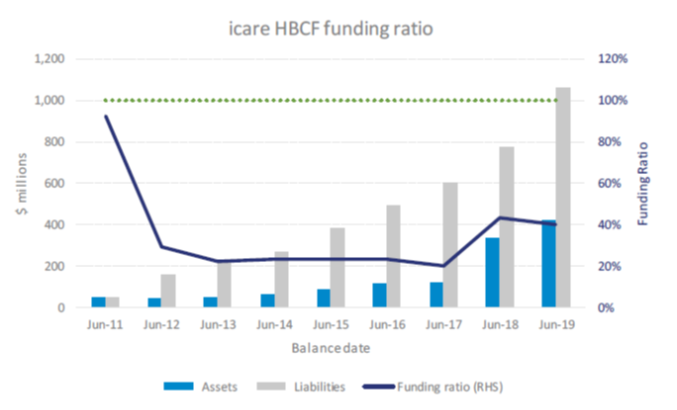
Scheme financial position
Figure 7 displays the historical funding ratio (assets divided by liabilities) for icare HBCF. At 30 June 2019, icare HBCF had 40 cents in assets for every dollar in liabilities. The economic downturn associated with COVID-19 is expected to place further pressure on the scheme’s financial position.
The increase in the funding ratio at 30 June 2018 was on account of a capital injection from NSW Treasury. The ongoing viability of the scheme is dependent upon Treasury funding to address historic premium under-pricing and continued under-pricing for the more risky construction types.
Figure 7 Historical icare HBCF funding ratio
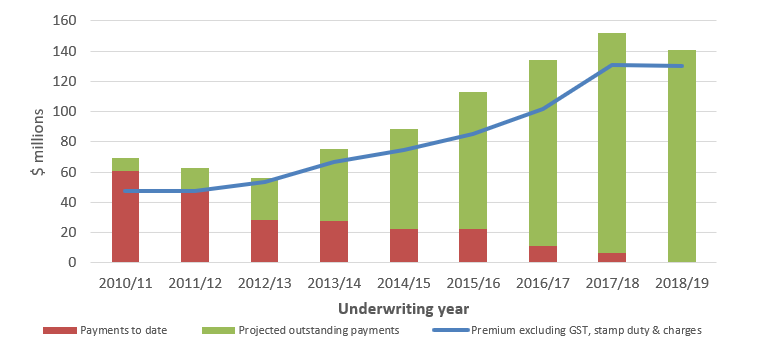
Premium income compared with expected claim costs
Figure 8 compares premium income and the expected cost of claims. The comparison is approximate and assumes the rate of investment income earned on premiums is equal to the rate of inflation.
The chart illustrates the gap between premium income and claims costs. The gap between premium income and the expected cost of claims has reduced since 2017/18. The growth in expected claims cost coincides with an increase in construction activity.
Figure 8 Comparison of estimated net claims cost and premium income ($ millions)
Scheme performance – Affordability
Are the premiums (certificates of insurance) affordable and perceived as affordable?
In this report, affordability is analysed utilising premium rates as a proportion of contract value. Premiums are considered affordable if they are not unreasonably high relative to contract value and do not unreasonably or unnecessarily add to the overall cost of construction.
Premium rates
Premiums are set as a percentage of contract value and reflect a combination of project risk and contractor-specific risk profiles and characteristics. Note the premiums displayed below are before the addition of GST, stamp duty and brokerage fees.
Figure 9 displays the actual premium rates that icare HBCF has reported it collected, for certificates of insurance by construction type and quarter. These may differ significantly from icare HBCF’s published base rates of premium, which are displayed for comparison purposes in a table following this graph. The table reflects that icare HBCF implemented changes to some premium rates on 2 October 2018.
Over the 2018/19 period as at 30 June 2019, the premium rate for new duplex / triplex was the highest across all construction types at 2.4 percent of contract value. Premium rates for new multiple dwellings had increased twice since March 2017, with an observed premium rate of 1.75 percent of contract value. Premium rates for new single dwellings increased by 38 percent over 2018/19, rising from 0.53 percent of contract value in September 2018 to 0.73 percent of the contract value as at 30 June 2019.
Figure 9 Reported premium rate by construction type and quarter
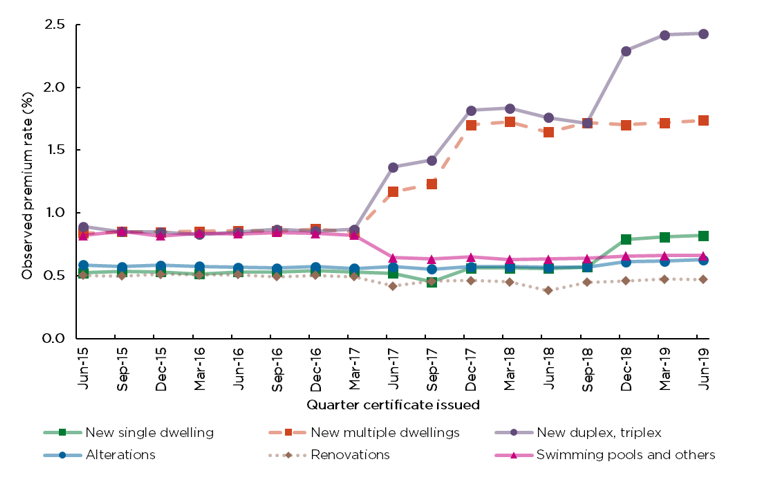
Note the premiums displayed below are before the addition of GST, stamp duty and brokerage.
Comparison with published premium base rates for 2018/19
The following table shows the premium base rates (before addition of GST, stamp duty and brokerage) published by icare HBCF for the period 2018/19.
Table 3 premium base rates for 2018/19
1/7/2018 – 1/10/2018 | 2/10/2018 – 30/6/2019 | |
|---|---|---|
C01 – New Single Dwelling | 0.66% | 0.95% |
C02 – Multi Dwelling Alterations - Structural | 0.58% | 0.58% |
C03 – New Multi Dwelling Construction Up To 3 Storeys | 1.72% | 1.72% |
C04 – Single Dwelling Alterations - Structural | 0.58% | 0.61% |
C05 – Swimming Pools | 0.66% | 0.67% |
C06 – Single Dwelling Renovations - Non-structural | 0.34% | 0.36% |
C07 – Other – not included above | 0.34% | 0.41% |
C08 – Multi Dwelling Renovations - Non-structural | 0.34% | 0.34% |
C09 – New Duplex, Dual Occupancy, Triplex, Terrace | 1.72% | 2.50% |
Scheme performance – Customer Experience
Does the scheme offer a positive customer experience?
To make a claim under the Home Building Compensation scheme, the contactor must have died, disappeared, become insolvent, or had their licence suspended due to non-compliance with a money order in favour of the homeowner making a claim. Because of these triggers, some customers will have necessarily engaged in sometimes lengthy and complex dispute resolution processes prior to being able to make a claim under the scheme. This ‘upstream’ experience may impact a homeowner’s perception of the scheme. Nonetheless, SIRA attempts to assess the customer’s experience within the scheme only.
Enquiries and complaints
The Home Building Compensation system provides a number of services to support positive customer experience. These services primarily assist customers with enquiries, complaints and disputes. While services may vary in purpose and process, they all aim to provide a positive, efficient and equitable service for customers.
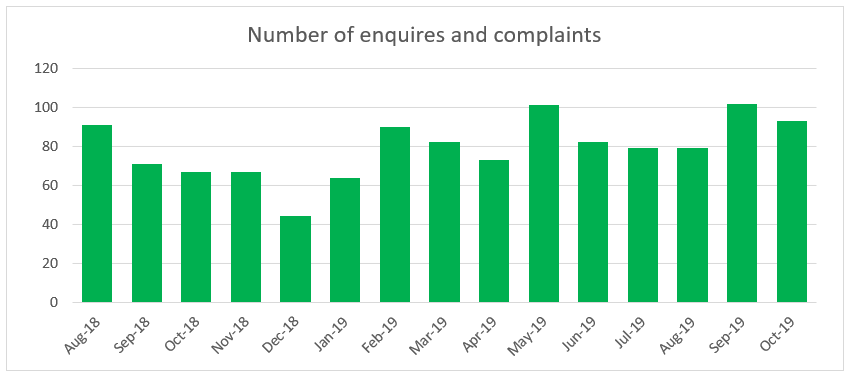
Customers can contact the SIRA advisory service to enquire about the system or raise complaints. SIRA’s enquiry and complaints services for Home Building Compensation receive on average 80 contacts per month. As this is a new measure to this report, a rolling 15 months of data has been provided as at October 2019. 1,088 of the contacts (92 percent) with the SIRA service centre were enquiries, with volumes relatively consistent across the period. The primary reason customers contacted the service centre was to enquire about when home building compensation cover is required.
The following graph shows the distribution of enquiries and complaints across the last 15 months.
Number of customer enquiries received by SIRA
Home Building Compensation Check
Home Building Compensation Check (HBC Check) is another service offered by SIRA. This website enables customers to check whether a certificate of cover has been issued for particular residential building works. In 2018-19, there were on average 5,250 searches per month on HBC Check.
Between June 2019 and February 2020 SIRA undertook a survey of users of the site to understand their experience and identify any desirable improvements that could be made to the service. Some key findings from the survey include the following.
- 52 percent of respondents were satisfied or very satisfied with HBC Check, with 19% responding that they were neither satisfied nor dissatisfied and 29% advising that they were dissatisfied or very dissatisfied.
- 71 percent agreed or strongly agreed that the information was easy to understand.
- 55 percent of respondents agreed or strongly agreed that the information was easy to find.
- 51 percent agreed or strongly agreed that the information they were looking for was available.
- 58 percent agreed or strongly agreed they liked the overall web site design.
Key areas that respondents identified for improvement included the locational accuracy and consistency of the insurer data displayed in HBC Check, and making the register easier to search and navigate. SIRA will use the feedback to inform future enhancement to HBC Check.
System Performance – Equity
Is the scheme and its eligibility and delivery mechanisms equitable and fair?
Contractors should be treated fairly and consistently in relation to eligibility and premium pricing; and the scheme should ensure that an adequate number of contractors are eligible to purchase home building compensation cover to enable customer choice. Homeowners should have equitable and efficient access to a transparent and effective claims process if they suffer an indemnified loss.
Contractor eligibility
Eligibility describes the process by which icare HBCF determines number, value and type of contracts requiring home building compensation cover that a contractor may have on foot at any given time. Eligibility requirements place limits on ‘open jobs’ based on the capability and capacity of the builder and risk associated with the projects.
As at the end of 2018/19 the HBC scheme had approximately 19,500 contractors eligible to purchase home building compensation cover.Figure 10 shows the number of eligible contractors at the end of each financial year by the maximum value of work for which they qualify.
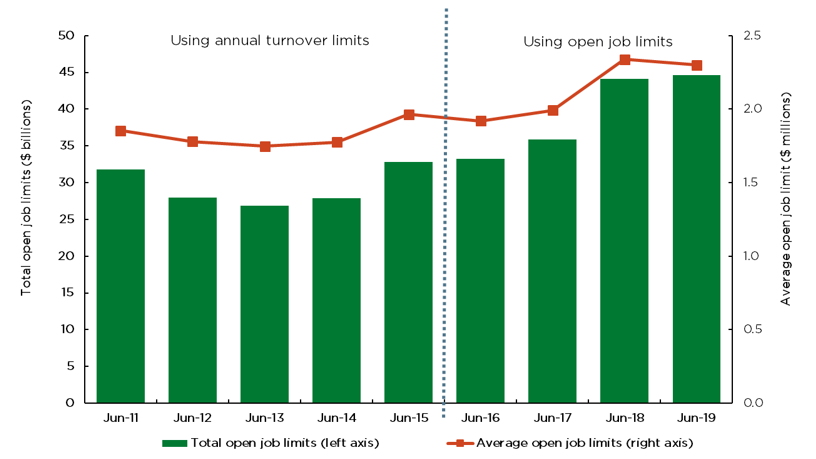
Figure 11 shows the total and average open job limits for eligible contractors at the end of each financial year. The total value of eligibility that icare HBCF granted across all contractors increased year on year from June 2013 to June 2019. This represents the total value of potential residential building work for which icare offered to underwrite contractors. The average value of eligibility granted per contractor increased between June 2013 and June 2015, with a subsequent dip between June 2015 and June 2016 concurrent with icare changing its eligibility arrangements from ‘annual limits’ to ‘open job limits’. Eligibility then increased again between June 2016 and June 2019.
Prior to August 2015, icare HBCF assessed eligibility on an annual basis and placed limits on a contractor’s annual turnover. From August 2015 onwards, icare HBCF assessed eligibility based on the projects a contractor is working on at any point in time through ‘open job limits’.
Figure 10 Number of eligible contractors at the end of each financial year
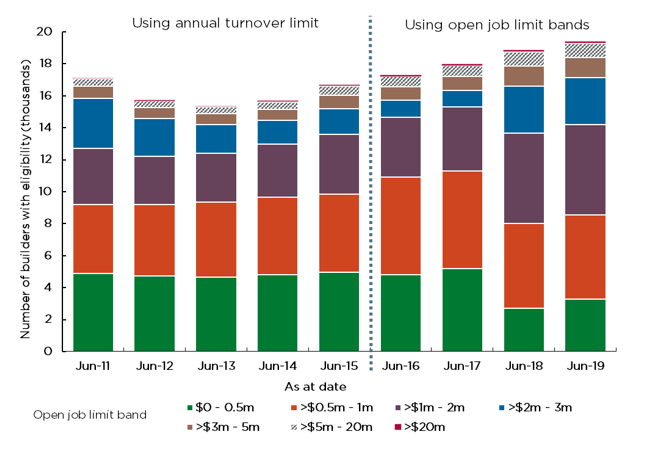
Figure 11 Value of total and average contractor eligibility limits as at the end of each financial year
Appendix A: Explanatory notes
Methodology and data limitations
The information presented in this report is primarily derived from insurer data received from icare, the scheme insurer. In addition, this report utilises data provided from icare HBCF’s annual declarations e.g. Premium filings and regular data exchanges with SIRA. SIRA has endeavoured to utilise the best possible data in this report balancing timeliness of the reporting with the longtail claims development cycle and data maturation.
Care should be taken in interpreting claims data for the more recent years, as it can take many years for claims related to building defects to emerge, and for the full claim costs to be known. In addition, some data quality challenges relating to completeness and correctness have been identified, which can impact the analysis in the report. It is important that SIRA transparently notes this for users of this report.
The data in this report for 2018/19 is as at 30 June 2019, except where otherwise indicated. The financial and cost information in this report is presented in original dollar values – without indexation. This report primarily focusses on insurance issued since 1 July 2010 for whichicare HBCF has been the sole provider.
Some additional notes in relation to claims data and development are set out below.
- The number of claims is also related to the number of certificates issued, i.e. the greater the volume of certificates of insurance issued (exposure), the higher the expected number of claims, all else being equal
- It is important to consider claims “emergence /development patterns” when assessing experience
- Defect claims have a longer “emergence /development pattern” than non-completion claims
- The notifications of loss and claims lodged in this section relate to policies issued from 1 July 2010
- Homeowners can notify their insurer that they have suffered a loss in order to preserve their ability to claim beyond the period of insurance in some circumstances. Note that not all notifications of loss necessarily progress to become a claim lodged. Notifications of loss can be finalised with no claim lodgement, for example if a homeowner succeeds in obtaining remedy from their contractor while they are still solvent
- All figures in this section of the scheme report relate only to claims lodged based on year of notification of loss
- Note that the count of the number of claims lodged is determined by their recorded liability status as at the current reporting date of 30 June 2019
- As at 30 June 2019, the recorded liability status of some notifications of loss reported in prior years may have changed as they progressed to become claims lodged, due to changes in the liability decision by the insurer. This would result in a different count of the number of claims lodged as at 30 June 2019, compared to the historical reported figures for prior years as reported in the last scheme report of 30 June 2018, particularly for more recent years
Home building compensation is a ‘long tail’ class of business:
- There may be a significant delay between the date a contractor enters into a contract of insurance for a building project, and the commencement date of work on the project
- The duration of a building project may range from a few weeks to several years
- For incomplete work, the period of insurance is twelve months from the date of the failure to commence the work or cessation of work (if it was started)
- If claim involves defective work, the period of insurance is either six years (major defects) or two years (all other defects)
- It may take some time for homeowners to identify a loss, lodge a claim with an insurer and for the insurer to assess the claim and arrange rectification
HBC claims experience varies greatly from year to year and is impacted by conditions in both the home building market and broader economy. Periods of high construction activity are generally associated with fewer insolvencies, and therefore fewer claims to the Scheme. The reverse is true of periods with low construction activity.
Claims lodged or paid in any given year can relate to insurance policies issued many years ago.
It is important to consider the characteristics of HBC insurance and the impact of broader economic conditions when interpreting the information in this report.
Assumptions
For the 2018/19 underwriting year, the following assumptions apply
- current estimate of cumulative claim costs of $177 million, comprising cumulative net claim payments ($0.5 million) and net undiscounted central estimate ($176.5 million)
- premium excluding GST, stamp duty and charges of $130 million, implies an underwriting loss of $47 million, or a loss ratio of 136 percent, for that year (albeit simplistic due to the inherent uncertainties of the estimates and other factors not allowed for).
Glossary
Standard terms | Definitions |
|---|---|
Certificate of insurance | A certificate evidencing a contract of insurance has been entered into for residential building work on a dwelling |
Contractor | Contractors are businesses (corporations, partnerships or individuals) that hold a ‘contractor licence’ under the Home Building Act 1989 to do residential building work. Contractors must buy HBC insurance for each residential project over $20,000 unless exempt. A contractor must have HBC insurance before starting work on a project or receiving payment. |
Construction type - alterations | Alterations relate to residential building works which are mostly structural. In this report, both alterations and renovations construction types include works on single or multiple dwellings or duplexes /triplexes. |
Construction type - renovations | Renovations relate to residential building works which are mostly non-structural. In this report, both alterations and renovations construction types include works on single or multiple dwellings or duplexes /triplexes. |
Contract of insurance | A contract of insurance under Part 6 of the Home Building Act 1989. Section 104B provides that the requirement to obtain insurance may be met by obtaining coverage through an alternative indemnity product (AIP), however no AIP providers were part of the HBC scheme during the period to which this report relates. |
Eligibility | ‘Eligibility’ is the term used to describe the approval by icare HBCF to enable a contractor to apply for a HBC certificate of insurance for residential building works in NSW, and the conditions under which the certificate of insurance may be granted |
GST | Goods and Services Tax |
HBC | Home Building Compensation |
icare HBCF | The NSW Self Insurance Corporation, trading as icare HBCF, which is currently the sole NSW government provider of HBC insurance |
NCAT | The NSW Civil and Administrative Tribunal (NCAT) is the one-stop-shop for specialist tribunal services in NSW. Matters previously heard in Consumer, Trader and Tenancy Tribunal (CTTT) are now heard in the Consumer and Commercial Division of the NSW Civil and Consumer Tribunal. |
Notification of loss | The notification to an insurer that a loss has become apparent arising from work covered by a contract of insurance for the purposes of s.103BB of the Home Building Act 1989. Note that not all notifications of loss necessarily progress to become a lodged claim. Notifications of loss can be finalised with no claim lodgement, for example if a homeowner succeeds in obtaining a remedy from their contractor. |
Open job limit | The approved maximum number and value of jobs an individual licensed contractor may have under construction at any point in time as a condition of eligibility granted by icare HBCF |
Premium rate | Percentage of total contract value charged for home building compensation cover. The average premium rate varies between construction types based on risk. |
Public Sector construction or building works | Please note - Public sector work has been excluded from the ABS data as this is exempt from the requirement to purchase HBC contract of insurance. |
Runoff insurers | Insurers that were approved by the Minister to write HBC insurance on or before 30 June 2010. While they all ceased writing business on or before 30 June 2010, runoff insurers continue to manage and settle claims on policies written up until that date. |
SIRA | State Insurance Regulatory Authority |
Appendix B: Summary of changes to the Scheme
Change | Description | Effective date |
|---|---|---|
Definition of defects | Structural defects and non-structural defects are called ‘major defects’ and ‘other loss’ respectively. A new definition is introduced for ‘major defects’. | 15 January 2015 |
‘Flammable external cladding’ is prescribed as a major defect. | 20 April 2018 | |
Eligibility profile | Contractor eligibility limit changed from ‘annual turnover limits’ to ‘open job limits’ i.e.– maximum number and value of jobs a contractor may have under construction at any given time. | 18 August 2015 |
Excess fee, if claim accepted | Reduced to $250 (previously $500) | 15 January 2015 |
Exemption for multi-storey buildings | Construction of high-rise buildings (more than three storeys that contain multiple dwellings) are no longer covered under the scheme (renovations and alternations of high-rise buildings continue to be covered). | 1 January 2004 |
Exemption for certain stand- alone contracts | Internal paintwork; kitchen and bathroom cabinetry; tennis courts; and ornamental ponds are not covered if work is done as a stand-alone contract. | 15 January 2015 |
Incomplete work | The legislation was amended to ensure insurers offer cover of at least 20 percent of the building contract price for incomplete works but may offer more | 1 February 2012 |
HBC Insurer | Runoff insurers ceased writing HBC business. | On or before 30 June 2010 |
icare HBCF became sole provider of HBC insurance. | 1 July 2010 | |
Minimum Cover | Increased to $300,000 (previously $200,000) | 28 February 2007 |
Increased to $340,000 | 1 February 2012 | |
$340,000 for single (combined) contract | 1 January 2018 | |
Owner builders cover | No longer issued. Instead, if the property is sold within seven years and six months from the date of issue of the owner builder permit, a consumer warning must be placed in the contract of sale of the owner-built property stating that the work is not insured. | 15 January 2015 |
Brokerage | icare HBCF ceased paying commissions to brokers | 3 April 2017 |
Reforms | Private insurers or alternate indemnity product providers can apply to SIRA for a licence to enter the market. Two types of covers may be offered:
| 1 January 2018 |
Scheme structure | Scheme changed from first resort to last resort. | 1 July 2002 |
Additional trigger – licence suspension due to non- payment of money order introduced (NCAT). | 19 May 2009 | |
Threshold (contract price requiring HBC insurance) | Increased to $20,000 (previously $12,000) | 1 February 2012 |
Appendix C: Data quality statement
June 2019 home building compensation report
Custodian of the dataset or data source: State Insurance Regulatory Authority (SIRA).
Description
The home building compensation data provides key statistics on home building compensation in NSW.
The current scheme began with policies issued since 1 July 2010. SIRA has been receiving HBC data relating to the current scheme on a monthly basis since the March 2018 quarter. Previously SIRA received this data on a quarterly basis. Eligibility data included in this report up to the March 2018 quarter uses historic snapshots of data previously provided to SIRA.
SIRA continues to receive claims information for policies issued by runoff insurers prior to July 2010 on a quarterly basis, which covers claims development since 1 July 2002.
Data quality rating
3 stars for:
- institutional environment
- accuracy
- coherence.
- Data quality levels by dimension
Institutional environment: Medium – star
Points awarded for:
- Agency publishing this data is the recognised data custodian
- Organisation has an active Data Quality Framework in place
- Data collection is mandated or required by Section 121C of the Home Building Act 1989
- Agency has no commercial interest or conflict of interest in the data.
No points awarded for:
- Data governance roles and responsibilities are not assigned for this dataset or data source.
Find out more about the data quality framework by contacting the custodian.
Accuracy: Medium – star
Points awarded for:
- Data is revised and publicised if errors are identified
- The impact of any adjustments or other changes are reported
- There are no known gaps in the data (for example: non-responses, missing records, data not collected)
- Any factors impacting validity are reported.
No points awarded for:
- This data has not been subject to quality assurance.
Find out more about the quality assurance processes from the custodian.
Coherence: High – star
Points awarded for:
- Standard definitions, common concepts, classifications and data recording practices have been used
- Elements within the data can be meaningfully compared
- This data is generally consistent with similar or related data sources
- This data is part of a time series. There have not been significant changes in the way data items are defined, classified or counted since the start of the series.
No points awarded for:
- There have been changes in data collection since the last release in this series.
Interpretability: Low
No points awarded for:
- No data dictionary is available to explain the meaning of data elements, their origin, format and relationships
- Information is not available about the primary data sources and methods of data collection (for example: instruments, forms and instructions)
- Information is not available to help users evaluate the accuracy of the data and any level of error
- Information is not available to explain concepts, help users correctly interpret the data and understand how it can be used
- Information is not available to explain ambiguous or technical terms used in the data.
Accessibility: Low
Points awarded for:
- This dataset or data source is available in a machine-processable, structured format
- This dataset or data source is not available in a non-proprietary format.
No points awarded for:
- This dataset or data source is not available on the web with an open licence
- This dataset or data source is not described using open standards and persistent identifiers
- This dataset or data source is not linked to other data, to provide context.
- Information to help users evaluate relevance
Scope and coverage
SIRA uses the HBC data to regulate the Home Building Compensation insurance in NSW. The HBC data includes eligibility information, securities information, certificates of insurance information, contractors’ premium information, claims information and claim payments information.
Target of the data collection: Contractors and claimants covered by the NSW home building compensation system.
Geographic detail
Data cover the following geographic area(s): State
At lower levels of geography, the data are represented or apportioned as follows: ABS statistical areas.
Outputs
The data are available as: Published (unstructured content, assembled into a form suitable for wide dissemination).
Other cautions
N/A
Reference period
Period for which the data were obtained: 01/07/2010 – 30/06/2019
- There were some changes to the data collection or observation period:
- HBC contracts of insurance for owner-builders are no longer issued after March 2015.
- HBC contracts of insurance for high rise buildings, i.e. new multiple dwellings (greater than three storeys), ceased to be issued after December 2003.
Timing
Updates and revisions: There is no revision policy.
Frequency of production
This information and data in this report is expected to be produced on a regular basis in an appropriate format.
Data disclaimer
The NSW Government is committed to producing data that is accurate, complete and useful. Notwithstanding its commitment to data quality, the NSW Government gives no warranty as to the fitness of this data for a particular purpose. While every effort is made to ensure data quality, the data is provided ‘as is’. The burden for fitness of the data relies completely with the user. The NSW Government shall not be held liable for improper or incorrect use of the data.
Understanding the data quality statement
The data quality statement aims to help you understand how a particular dataset could be used and whether it can be compared with other, similar datasets. It provides a description of the characteristics of the data to help you decide whether the data will be fit for your specific purpose.
About the data quality rating:
The reporting questionnaire asks five questions for each of these data quality dimensions:
- institutional environment
- accuracy
- coherence
- interpretability
- accessibility
For each question: ‘yes’ = 1 point, ‘no’ = 0 points. The number of points determines the quality level for each dimension (high, medium, low).
Only dimensions with four or five points receive a star.
Points | Quality level | Star/No star |
|---|---|---|
0 | Low | No star |
1 | Low | No star |
2 | Low | No star |
3 | Medium | No star |
4 | Medium | Star |
5 | High | Star |
Evaluating data quality
Quality relates to the data’s ‘fitness for purpose’. Users can make different assessments about the quality of the same data, depending on their ‘purpose’ or the way they plan to use the data.
The following questions may help you evaluate data quality for your requirements. This list is not exhaustive. Generate your own questions to assess data quality according to your specific needs and environment.
- What was the primary purpose or aim for collecting the data?
- How well does the coverage (and exclusions) match your needs?
- How useful is this data at small levels of geography?
- Does the population presented by the data match your needs?
- To what extent does the method of data collection seem appropriate for the information being gathered?
- Have standard classifications (e.g. industry or occupation classifications) been used in the collection of the data? If not, why? Does this affect the ability to compare or bring together data from different sources?
- Have rates and percentages been calculated consistently throughout the data?
- Is there a time difference between your reference period, and the reference period of the data?
- What is the gap of time between the reference period (when the data was collected) and the release date of the data?
- Will there be subsequent surveys or data collection exercises for this topic?
- Are there likely to be updates or revisions to the data after official release?