


Print PDF
CTP Scheme quarterly report - March 2017
Introduction and summary
The New South Wales Compulsory Third Party (CTP) Scheme is governed by the Motor Accidents Compensation Act 1999 (the Act). The Green Slip market currently comprises six licensed insurers operated by four entities: Suncorp (AAMI and GIO), Allianz Australia (Allianz and CIC Allianz), NRMA and QBE. The market is split into two segments: retail and non-retail. AAMI, GIO, Allianz and NRMA compete mainly in the retail segment, CIC Allianz competes in the non-retail commercial vehicle market and QBE operates in both market segments. Zurich ceased issuing Green Slip policies from 1 March 2016.
Under the Act, the State Insurance Regulatory Authority (SIRA) reports on premium market share to each insurer each quarter. SIRA also provides insurers with a detailed claims report and a price trend report each quarter. The claims report provides aggregate claims numbers and claims costs, illustrating the claims experience of the current scheme and the ‘run-off’ of the previous (pre-1999) scheme.
During the December 2016 quarter, five insurers implemented new prices with various effective dates to reflect deterioration in claims frequency, low government bond yields and changes to the bonus and loading structure in some cases.
GIO continued to be the insurer with the best price by offering $590 for a Sydney passenger vehicle. Despite NRMA’s best price being $34 above GIO, NRMA dominated the market with a share of around 30 per cent due to its brand impact, branch network and product bundling.
The price changes implemented during the December 2016 quarter resulted in an average premium of $702 for Sydney passenger vehicles and an average premium of $482 for regional passenger vehicles.
All six insurers filed for varying price increases during the reporting quarter to be effective during the March 2017 quarter. The price increases were generally due to:
- increases in claims frequency (the number of claims per 10,000 vehicles)
- changes to the bonus and loading structure.
GIO will maintain its position as the market price leader for Sydney passenger vehicles by offering the lowest headline price ($606), while CIC Allianz will be offering the highest best price ($673) during the next quarter.
Price increases are in line with the upward trend in the frequency of claims evident since 2008 (Graph 5), however despite relatively greater stability in claim frequency for the last four quarters to December 2016, since the start of current Act in 1999, this is still the highest number of claims reported within the first three months of any December accident quarter.
Green Slip premiums and market trends
Insurer premium filings
Insurers set their own Green Slip premiums in a competitive market, within part 2.3 of the Act and the Motor Accidents Premiums Determination Guidelines approved by the SIRA Board. Insurers can file proposed premiums with SIRA at any time and there is no limit to the number of filings an insurer may lodge each year.
SIRA may only reject a premium filing if it is of the opinion that the premium:
- will not fully fund the present and likely future liability of the insurer
- is excessive having regard to actuarial advice and to other relevant financial information
- does not conform to the Motor Accidents Premiums Determination Guidelines (PDG).
The scheme actuary, Ernst and Young, and SIRA internal analysts review the assumptions underpinning each premium filing. The assumptions include projected industry and insurer’s claims costs, economic factors, expenses, profit loading and insurer’s forecast market share.
Adjustments to the Medical Care and Injury Services
(MCIS) levy
The MCIS levy is made up of a Motor Accidents Fund (MAF) levy and Lifetime Care and Support (LTCS) levy. SIRA Board is able to review and adjust the SIRA component of the MCIS Levy as required under s.213 and s.214 of the Act. SIRA sets the levy in order to generate a balanced budget outcome, while maintaining a preferred prudential reserve target.
The LTCS levy component could also be adjusted by the Insurance and Care NSW (icare) Board of Directors to meet the Board’s target funding amount for a specified period. During the March 2017 quarter, the components of the MCIS levy rates were adjusted. The MAF levy rate was reduced by 0.25 per cent to 9.25 per cent and the LTCS levy rates were coincidentally reduced by 0.9 per cent across all vehicle classes and regions, resulting in an average reduction of 1.1 per cent in the MCIS levy rates. These adjustments took effect from 15 January 2017.
Headline prices
Table 1 shows the changes in headline prices that occurred during this reporting quarter. The headline price is the lowest CTP premium price (including levies and GST) offered by each insurer to a new retail customer, aged 30 to 54, for a private use passenger vehicle garaged in Sydney.
GIO continued to offer the best market price for a Sydney passenger vehicle during this reporting quarter. The dominant premium market share insurer, NRMA, was $34 higher than the market price leader, GIO.
Table 1: Sydney car headline price changes
| Filing period (quarter) | NRMA | GIO | AAMI | Allianz | QBE | CICA |
|---|---|---|---|---|---|---|
| March 2017* ($) | 640 | 606 | 622 | 623 | 613 | 673 |
| December 2016* ($) | 624 | 590 | 603 | 628 | 611 | 662 |
| September 2016* ($) | 611 | 578 | 592 | 604 | 603 | 653 |
| March 2017* price change $ (%) | 16 (2.6) | 16 (2.7) | 19 (3.2) | -5 (-0.8) | 2 (0.3) | 11 (1.7) |
| December 2017* price change $ (%) | 13 (2.1) | 12 (2.1) | 11 (1.9) | 24 (4.0) | 8 (1.3) | 9 (1.4) |
* Prices came into effect in March 2017 quarter
It should also be noted that the highest price for Metropolitan Class 1 passenger vehicle has reached $900 based on the latest insurer filings.
Premium market share
Insurers are required under the Act to submit information on insurance premiums to SIRA at the end of each quarter. This information is used to determine the premium market share for each insurer and to report trends in premium levels over time.
The total amount of premiums collected (excluding MCIS levy and GST) during the year to 31 March 2017 was $2.59 billion. This represented an increase of around 13.1 per cent on the previous year ($2.29 billion).
Table 2 shows NRMA continues to lose market share year-on-year, but still remains the dominant insurer in the market. Its premium market share at the end of this reporting quarter was 30.7 per cent, compared to 33.2 per cent the same period last year. GIO gained a significant 5.1 per cent market compared to the March 2016 quarter.
Allianz and CIC Allianz gained a marginal 0.6 per cent and 0.3 per cent market share respectively compared to the March 2016 quarter. NRMA, QBE and AAMI lost 2.5%, 1.3% and 0.7% market share respectively compared to March 2016 quarter.
Table 2: Insurer market share in the NSW CTP scheme
| Insurer | Four quarter average % | Premium share for individual quarters (s.172) % | ||||||||
|---|---|---|---|---|---|---|---|---|---|---|
| Mar 17 | Dec 16 | Sep 16 | Jun 16 | Mar 16 | Dec 15 | Sep 15 | Jun 15 | Mar 15 | ||
| AAMI | 8.1 | 7.8 | 7.6 | 8.2 | 8.8 | 8.5 | 7.6 | 10.1 | 10.6 | 10.4 |
| Allianz | 12.3 | 13.2 | 12.5 | 11.4 | 12.2 | 12.6 | 11.9 | 11.2 | 12 | 12.6 |
| CIC-Allianz | 6.3 | 6.1 | 6.9 | 6.6 | 5.7 | 5.8 | 6 | 6.1 | 5.2 | 5.1 |
| GIO | 20.1 | 20.5 | 21.1 | 20.1 | 18.8 | 15.4 | 14 | 14.1 | 13.2 | 13.3 |
| NRMA | 31 | 30.7 | 30.7 | 30.2 | 32.5 | 33.2 | 31.1 | 32.9 | 34 | 33.9 |
| QBE | 22.2 | 21.9 | 21.2 | 23.5 | 22 | 23.2 | 22.7 | 21.3 | 21 | 20.5 |
| Zurich | -0.1 | 0 | 0 | 0 | 0 | 1.3 | 6.7 | 4.2 | 4.1 | 4.3 |
| Total | 100 | 100 | 100 | 100 | 100 | 100 | 100 | 100 | 100 | 100 |
Graph 1: Premium market share (rolling 12-month) comparison
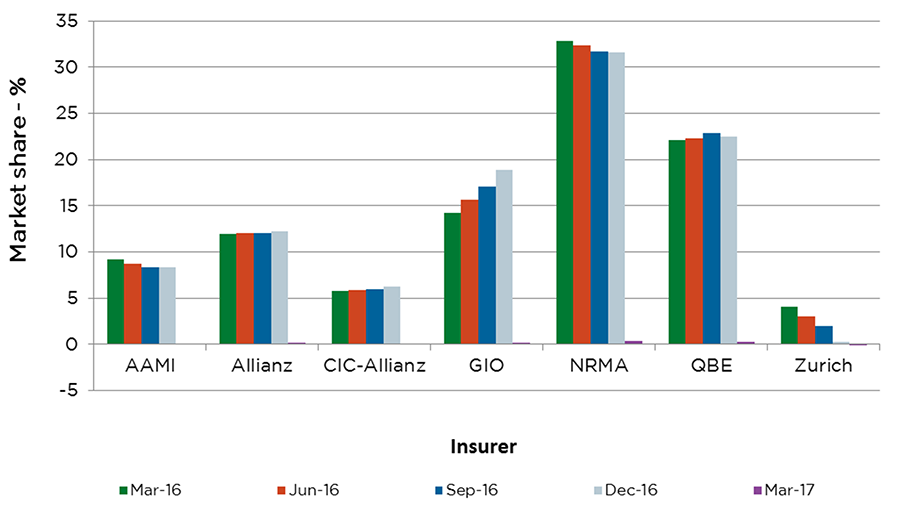
Graph 1 shows the proportion of premiums collected in the 12 months to the quarter end. Based on rolling twelve month periods this graph reduces any volatility that exists from quarter to quarter due to the seasonal renewal of large fleet vehicles and shows smoother trends in market share.
AAMI, NRMA and QBE market shares continue to decrease, while GIO continues to gain significant market share in the last twelve months. Allianz and CIC Allianz market shares have been relatively stable.
Premium trends
Since 2008, Green Slip premiums have generally continued to experience upward pressure (Graph 2).
Contributing factors are:
- increasing claims frequency even though it appears to decline in the last three quarters.
- low bond yields, resulting in low investment returns for insurers (Graph 3).
While the increase in the number of small claims reduces the overall average claims cost, the long term increase in claims frequency means the overall effect is an increase in the cost per policy. These cost pressures are expected to continue in 2017 resulting in further increases in Green Slip prices.
Graph 2: Average premium (quarterly trends)
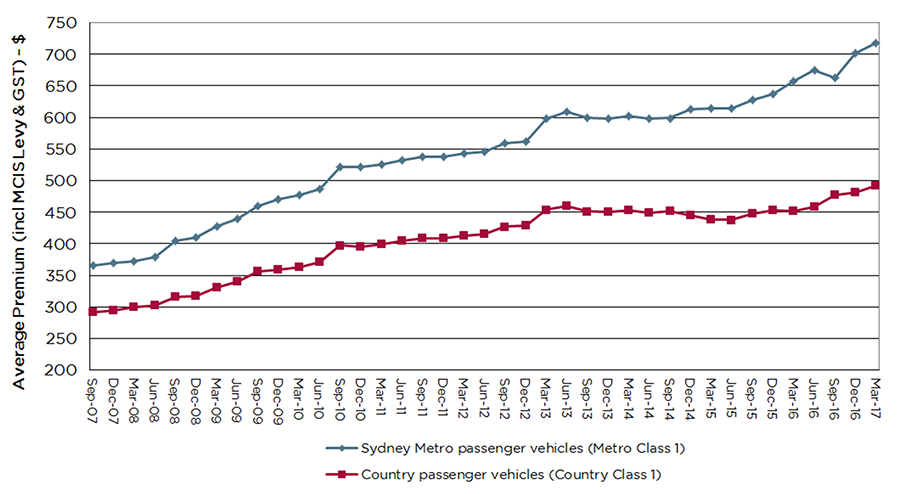
In the March 2017 quarter:
- The average premium (including MCIS levy and GST) paid by Sydney passenger vehicle owners was $718, an annual increase of $61 (9.3 per cent).
- The average premium paid by regional passenger vehicle owners was $492, an annual increase of $40 (8.8 per cent).
Premium prices are also affected by insurers’ investment returns. Graph 3 shows movements in the five-year Commonwealth Government bond yield since the inception of the current CTP Scheme 17 years ago.
Graph 3: Trend in five year Commonwealth bond yield to 31 March 2017
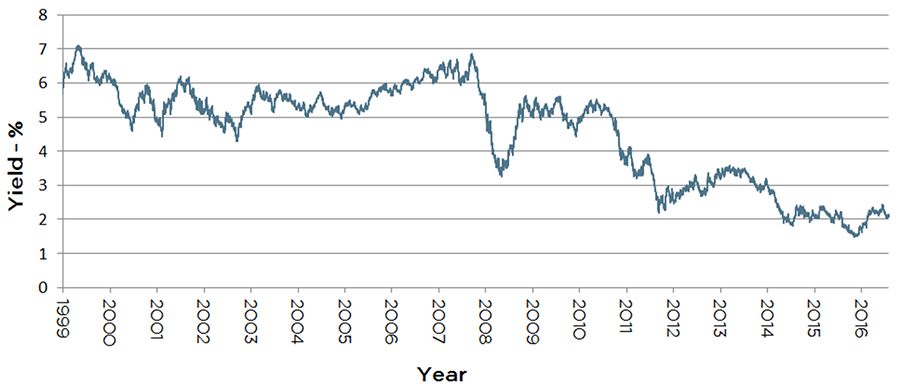
Low bond yields have a negative impact on the investment returns of insurers who invest collected premiums in the bond market. The yield on the five-year Commonwealth Government bond has been at historically low levels in recent years and material changes are not expected in the short term. Movements in five-year bond yields are generally consistent with movements in the yields of other maturities.
Claims trends
Number of claims
Newly reported claims
Claims trends are measured from 5 October 1999, when the current Act (MACA) came into effect. The scheme actuaries complete an annual valuation of the scheme in June each year to provide projections for the number of claims expected to be reported. In the March 2017 quarter, the actual number of newly reported claims since the previous quarter, December 2016, was 3,883 (16 per cent) less than the 4,597 anticipated from the June 2016 valuation of the scheme. Some of these newly reported claims were lodged with respect to past accident quarters. However, the number of claims reported from accidents in the latest accident quarter, March 2017, was 2,003, which breaks the trend that started in March 2008. This reduction could be because of a number of factors including: the new Legal Costs regulation; a market response to Strike Force Ravens, which was set up in August 2016 to investigate CTP fraud in South Western Sydney; and implementation by insurers of new claims management practices designed to combat fraud and exaggeration.
Claims by accident quarter
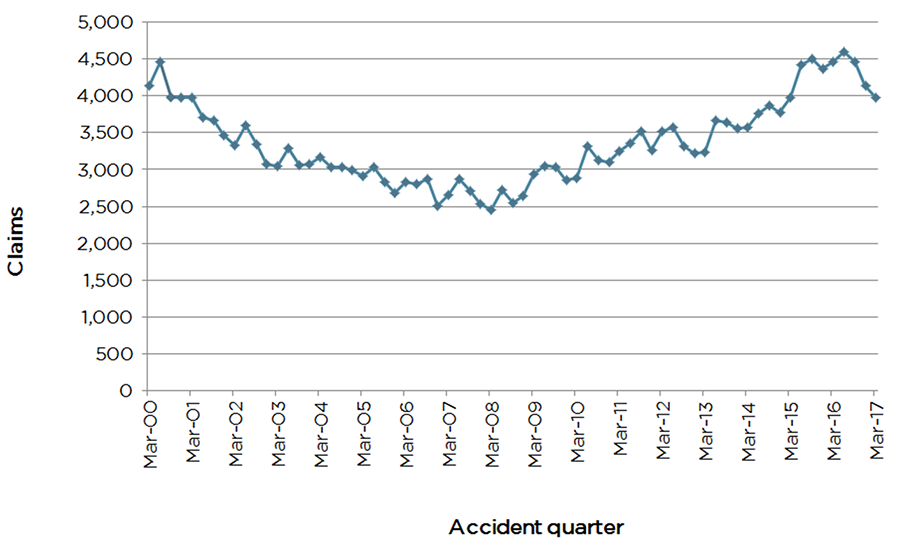
Graph 4 shows the number of CTP claims per accident quarter. Since March 2008 there has been a clear upward trend in the number of claims per accident quarter from 2,451 in March 2008 to 4,597 in June 2016 and thereafter the number of CTP claims per accident quarter is estimated to decline to 4,138 in December 2016 and 3,983 in March 2017.
Graph 4: Claims by accident quarter
Claim frequency
Claim frequency is defined as the ultimate number of claims divided by the number of registered vehicles. The ultimate number of claims comprises all reported notifications (full claims and Accident Notification Forms (ANFs)) plus an estimate of claims yet to be reported.
Graph 5 shows the trend in claim frequency by accident quarter. Claims frequency increased consistently from 22 claims per 10,000 vehicles in March 2008 to 34 claims per 10,000 vehicles in June 2016 and thereafter it has declined. The estimated claim frequency for the March 2017 accident quarter is 29 claims per 10,000 vehicles and the average for the year to March 2017 is 32 claims per 10,000 vehicles.
Graph 5: Trend in claims frequency
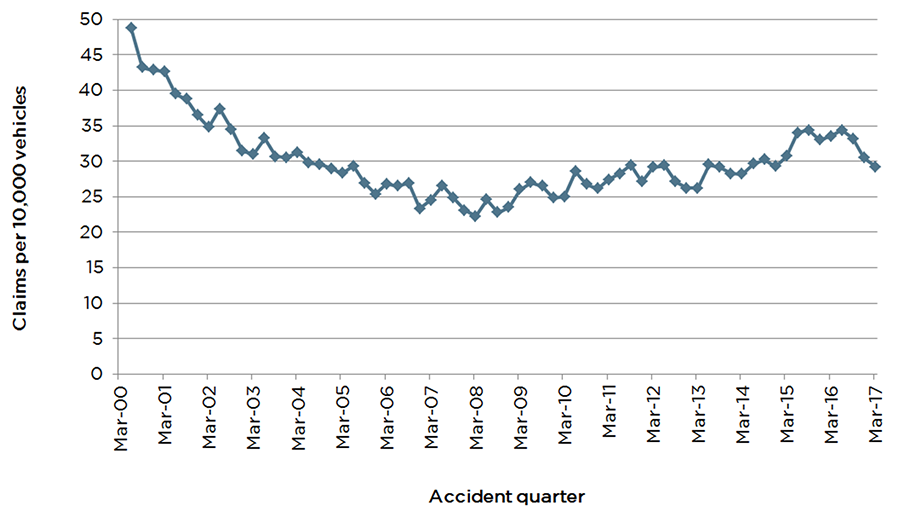
Note: For the more recent accident quarters, projections are based on incomplete claims hence data presented for these quarters are just indicative and depend on the robustness of ultimate claims projections.
Claims cost
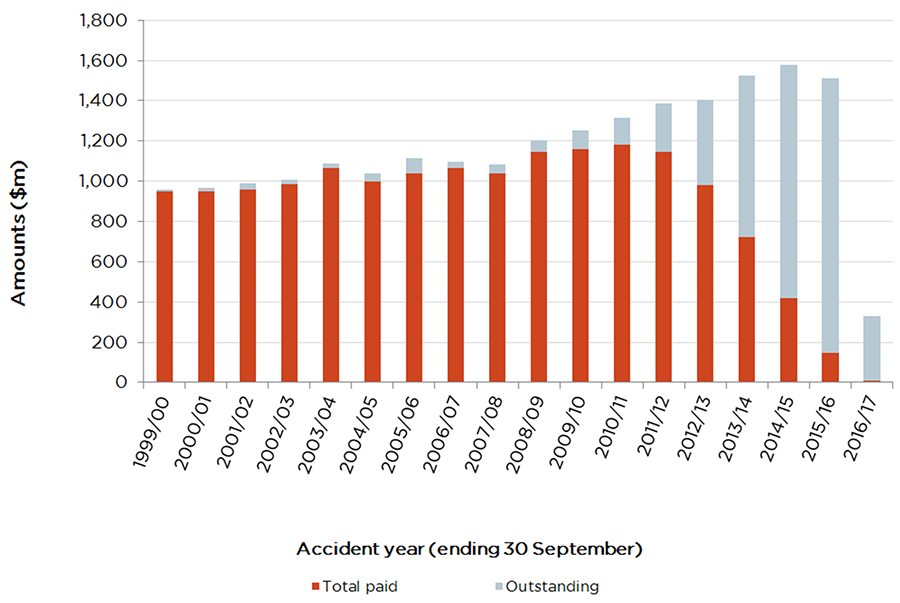
As at 31 March 2017, a total of 233,227 notifications (full claims and ANFs) with a total incurred cost of $20.8 billion has been reported since the current scheme commenced in October 1999. It is estimated that $4.9 billion (23%) is yet to be paid for claims reported to date.
Graph 6 shows how this unpaid amount is distributed across prior full accident years. Further development in payments is anticipated for accident year 2016/17, which has only two out of four quarters worth of claims reported for the accident year as at 31 March 2017. Also, as late claims are reported and estimates for already reported claims get revised, the actual incurred costs becomes more evident.
Graph 6: Payments on reported claims as at 31 March 2017
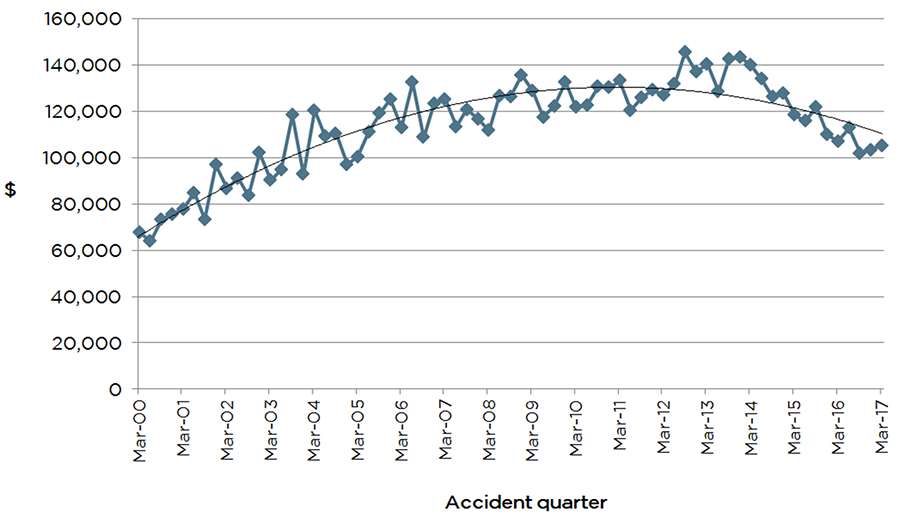
The trend in average incurred costs of full claims that have already been lodged with CTP insurers is shown in Graph 7 below. The incurred costs are historic amounts supplied by insurers and are not adjusted for inflation.
Since the start of the MACA 1999 scheme, the average incurred cost increased from about $68,000 in March 2000 to about $145,000 in September 2012 and then began to fall thereafter. For claims already reported, insurers will continue to revise their cost estimates as more information is received on these claims. Insurers are yet to receive late claims from some accidents that have already occurred but not yet had claims lodged; this especially applies to the four most recent accident quarters.
These revisions and late reports introduce some uncertainty in the average cost estimates hence the trend line superimposed on Graph 7 presents a more likely level of final average costs of claims in more recent accident quarters. The average incurred costs of claims, arising from accidents in March 2016 is more likely to be around $116,000 and $110,000 for claims from the March 2017 quarter.
Graph 7: Average incurred cost (full claims only)
About SIRA
SIRA is the government organisation responsible for the regulation of workers compensation insurance, motor accidents compulsory third party (CTP) insurance and home building compensation in NSW.
We focus on ensuring key public policy outcomes are achieved in relation to service delivery to injured people, affordability, and the effective management and sustainability of these insurance schemes.
For the NSW motor accidents insurance scheme, we monitor insurer performance, support road safety initiatives, promote optimal recovery for injured people and provide an independent dispute resolution service.
SIRA assumed the regulatory functions of the former Motor Accidents Authority from 1 September 2015.
Contact
Director, CTP Market and Premium Supervision
SIRA, Motor Accidents Insurance Regulation
[email protected]